6 min read
CRM software for high-performance sales teams
There are several different techniques sales managers can explore when considering how to do a sales forecast. If you are just starting out at a company with little to no readily available sales data with which to conduct your forecast, you’ll need to look at some of the qualitative methods. These include: expert panels, the Delphi Method, market surveys and sales rep feedback.
However, if you are fortunate enough to have some sales data on hand then you need to consider some of the quantitative methods of sales forecasting. These include: historical growth rate, linear extensions, run rate, moving simple average and the exponential smoothing technique, and it’s the latter of these that we are going to focus on today.
That’s because it’s consistently the most accurate method at forecasting sales.
Other time series models (those that analyze sales over a set period of time in the past, to predict the future) such as run rate or simple moving average work well when the series is stable and not subject to much fluctuation or change.
The problem is that sales are rarely stable.
Depending on the industry sales are often affected by trend or seasonality. For example, If you work in retail then your are likely to see spikes around Thanksgiving and Christmas. Or perhaps you are in the utility sector, which typically see increases in consumption of gas and electric over the Winter period as people start to turn up the heating.
While we need to place greater weight on more recent sales periods, we must also remember that trends and seasonality are cyclical and eventually come to an end.
Unlike other quantitative models, which use a fixed amount of the latest available data from the time series, the exponential smoothing technique incorporates data over a much greater period of time, that reduces in importance exponentially.
Hence, exponential smoothing!
That’s all well and good, I hear you saying, but I still don’t really understand how to do a sales forecast.
First off you are going to need the right software to do the forecast. Excel has its own exponential smoothing module, that, despite not being the most sophisticated piece of software available for forecasters it will more than suffice.
So let’s start there.
There are two ways to go about.
First is to use the built-in exponential smoothing tool provided by Excel.
You’ll need to lay out your sales data in a standard chart before you can analyze it with the forecast module.
In this example I’m going to use sales data from the last 12 months to forecast revenue for January Q1 or month 13, in this case. You will need to lay out your data in 2 columns:
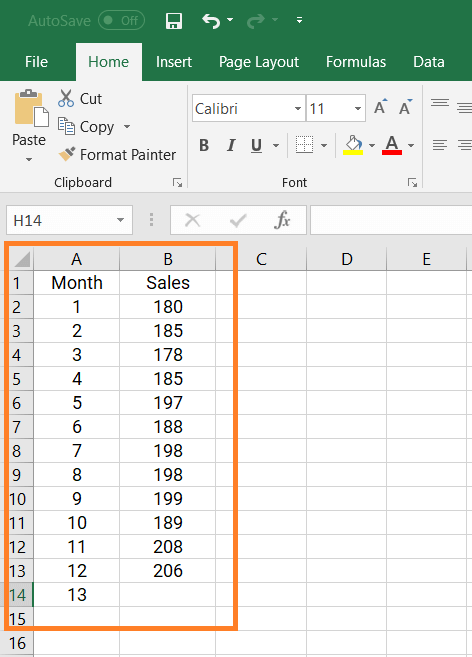
Next you will need to click the Data tab at the top of the Excel sheet (between Formula and Review) which will cause the following drop down menu to appear.
You’ll need to head over to the top right-hand corner and select the Data Analysis tab

If you don’t have the data analysis feature enabled in Excel it’s quite simple to install:
Anyway, clicking the data analysis tab you will be prompted fill out a box of different analysis formulas. Go ahead and click on Exponential Smoothing.
You’ll then be asked to fill out the following grid:
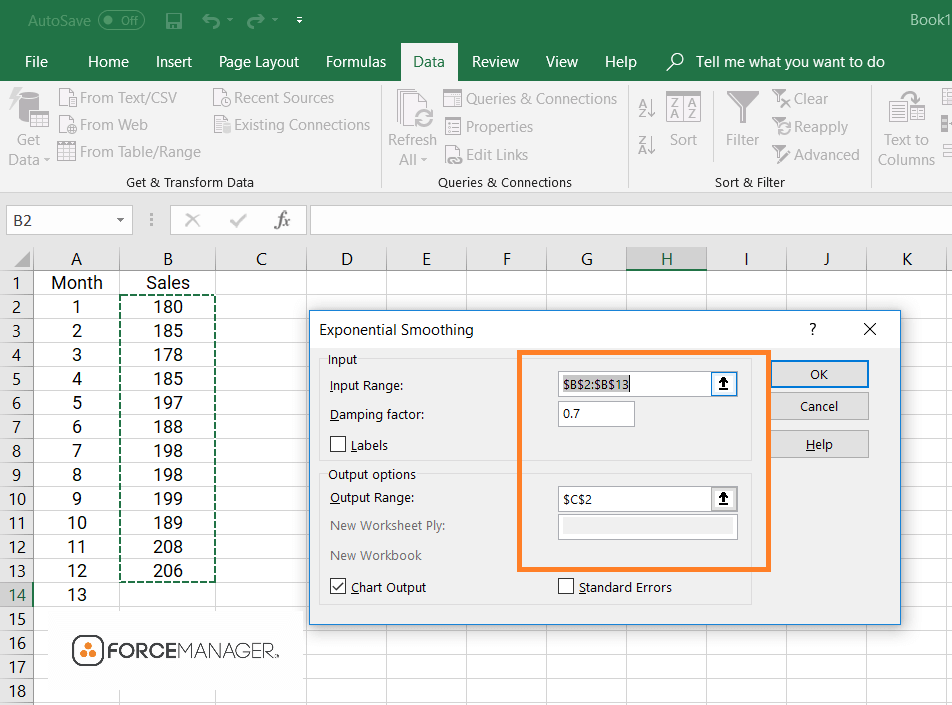
It’s now a case of filling it in.
The input range will be your sales figures, so go ahead and highlight cells B2 to B13 into the allocated space.
Next step is to add the “damping factor”. If you are unfamiliar with the term damping factor its a reference to the weight placed on the most recent sales results. It’s score on a scale of 0-1
So if you work in an industry that experiences regular, unpredictable spikes in sales, then you are going to want steadier exponential smoothing. I suggest you go for a number between 0 – 0.5.
If you your industry is experiencing an unprecedented increase in sales, on the other hand, then you need to place more emphasis on say the last 2-3 time periods. You’ll want to go for a number between 0.6 – 1.
The last step in the process is to select where you’d like your exponential smoothing results to go, so go ahead and click on the cell C2. A line chart and set of results will then appear as follows:
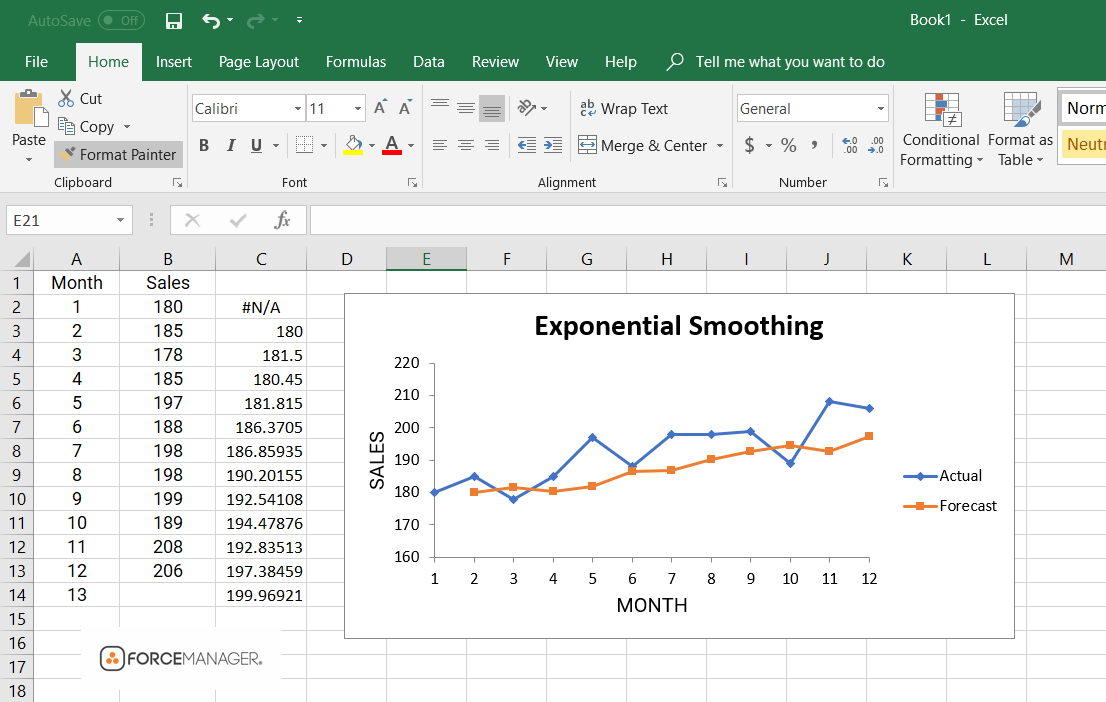
As you can see the exponential smoothing forecast appears as a set of predicted revenue figures, as seen in column C, as well as a line graph.
To calculate the forecast for month 13, simply click on the bottom right hand corner of the forecasted value for month 12, and drag down. The cell will automatically fill with the projected forecast (in the case above: 199,97).
Easy!
[banner_newsletter_en]
Now if for whatever reason you were unable to install the data analysis plug-in as shown above, don’t sweat it; there is a slightly more roundabout way of getting the same results.
It does start off with this nasty looking formula:
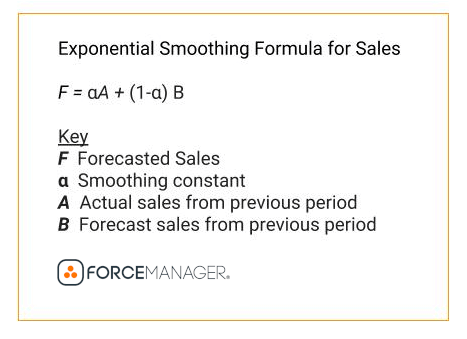
Now don’t worry about the fancy jargon too much. It basically means to get your forecast (F) you need to multiply your smoothing constant (α the weighted score we talked about previously) by the actual sales from the last period (A). You then add those 1 – the weighted score and times it by the forecasted sales from the previous period (B)
Using the exact same data as for the previous forecast, let’s see how we need to set it up in Excel:
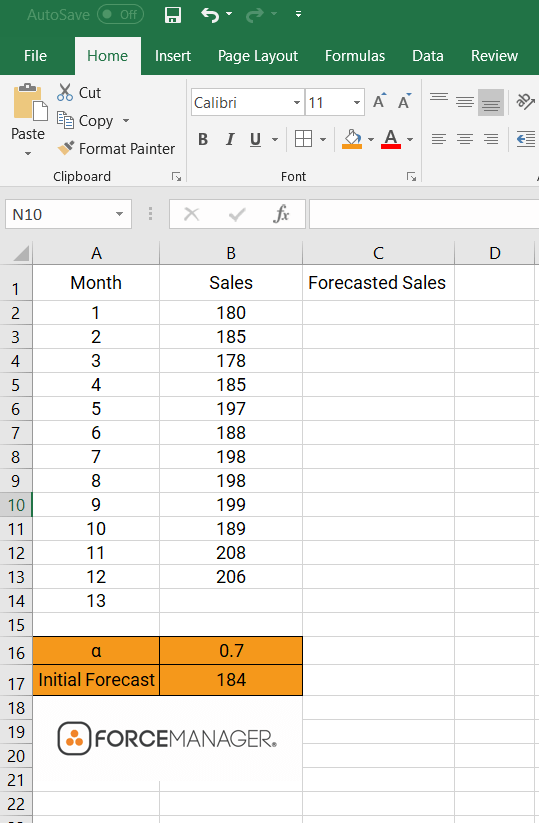
As you can see, there are a couple of additions to this second technique.
First is the α cell in B16. This works in exactly the same way as the damping factor from the previous example; providing a weight to the latest, and therefore assumed most important sales data. The closer the number is to 1, the more important the latest sales data is considered.
Secondly we have the initial forecast in cell B17. Obviously we can’t forecast for month 1 as we have no previous data to add to the formula, so we are going to insert a best guess at what that might have been, in this case I went with 184.
And the final column is going to be where we will insert our formula under Forecasted Sales.
The first step is to go ahead and pop your initial forecast from figure from B17 into the cell C2. One that’s done, we can go ahead and crack on with our formula, adding it to cell C3
If you’ve forgotten what the formula was exactly: F=αA+(1-α)B
Remember, when adding the formula you must click on the corresponding cell i.e. when adding α click on cell B16. If you simply type the corresponding numerical value you will not be able to drag down your predictions to the rest of the forecasted sales cells.
If done correctly, it should look something like this:
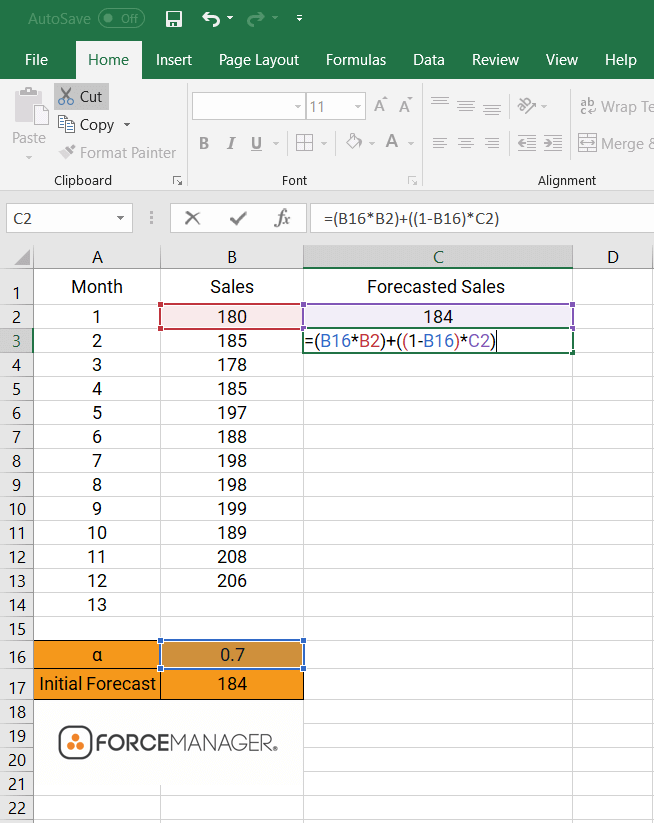
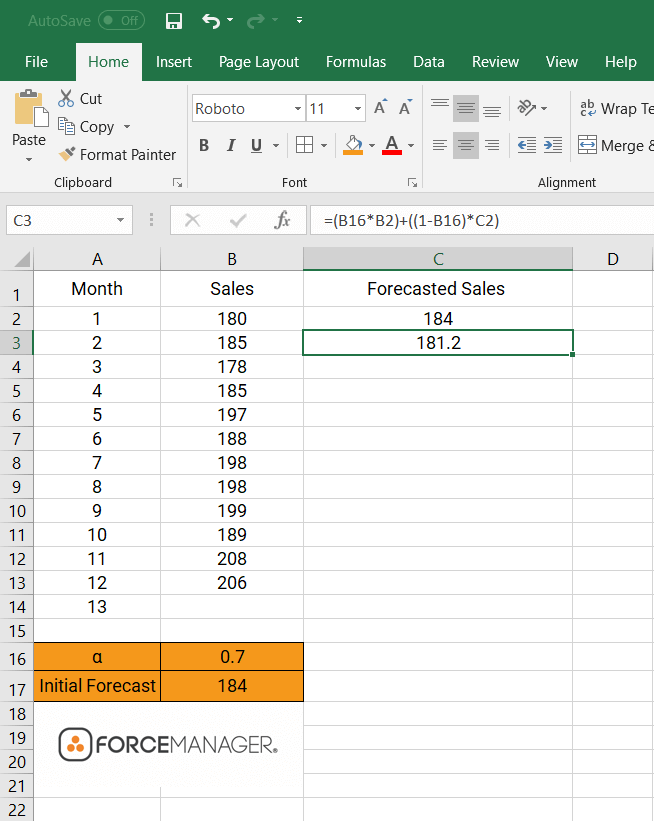
Go ahead and punch enter to get your forecast sales for month 2:
Now because we need to use absolute cell referencing for our formula (an Excel thing) there’s one little thing we must to before we finish. In order to keep the value of α constant we need to add dollar signs ($) before and after the letter of the α cell.
Sounds a little strange but this is what I’m getting at:
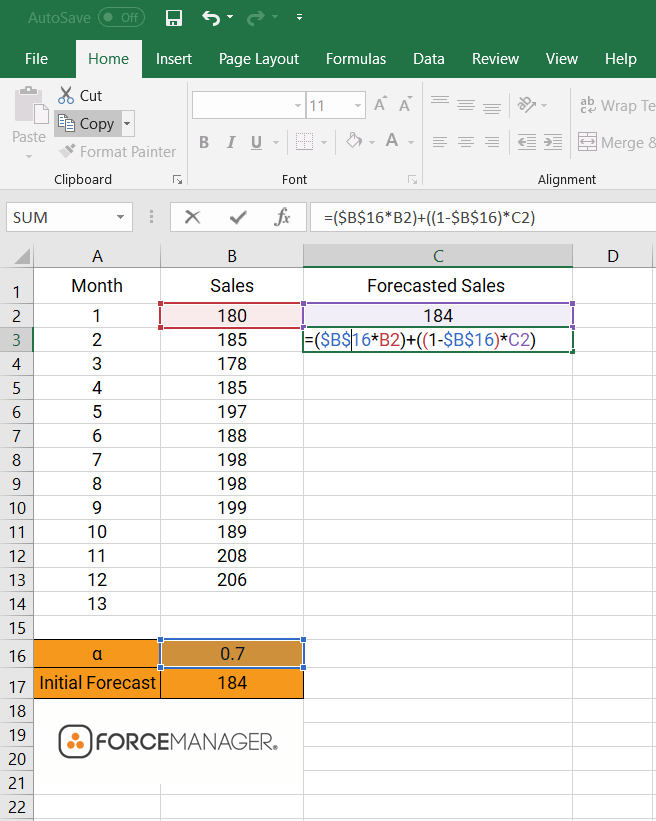
You see before and after the letter B (a reference to the α cell letter) there are two ($) signs. This will ensure the value remains constant.
Go ahead and hit enter, and from the bottom right hand corner of the cell, drag it down to month 13. The value that appears in cell C14 is your forecasted sales:
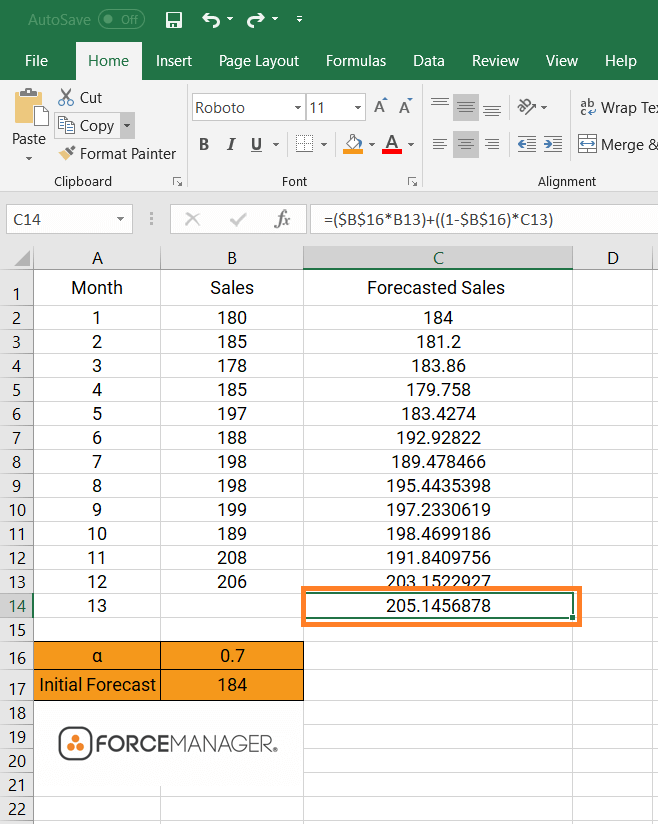
Giving us a rounded up figure of 205.15.
If you found this a little difficult to follow Eugene O’Loughlin, a professor from the National College of Ireland does a great job of explaining how to do a sales forecast step by step in this video.
While there is nothing wrong with the sales forecasting methods shown above using Excel, it is true there are specific pieces of software out there designed just for forecasting. They are more accurate and not necessarily that difficult to operate.
It’s understandable, though, that many field sales manager are limited to the software packages and plugins they are able to use. IT can work themselves up into hysteria when asked to approve new systems, but if you are successful in convincing them of the importance of sales forecasting then I recommend you look at Peerforecaster.
This incredibly simple to use Excel plugin (that’s free by the way) consistently outperforms some of it’s paid counterparts.
You are able to make several adjustments to the forecast: whether you want to forecast by month or quarter, adjust seasonality and trends or if you wish to look at Standardized Errors, ACF or PACF.
Whatever system you decide to go with remember that the forecasts they produce are only as good as the data that is entered into them. If you’re feeding them garbage, then expect garbage reports and forecasts in return. To ensure the maximum data accuracy and input from your field sales team try looking into a mobile CRM app. By simplifying the data entry process for sales reps on the move, the sales management software ensures that when conducting your next forecast, you can be quietly confident in the accuracy and relevancy of its results.